We show you the big picture.
LOW FRICTION
Experience a low friction onboarding process that is designed to minimize effort or hurdles on your part. We prioritize creating a low effort experience from the moment you begin your journey with us. Our streamlined onboarding procedures ensure that you can quickly and easily integrate our services into your operations, without encountering unnecessary obstacles or complications.
PRIVACY
At Auspex Labs, we operate on the principle that access to your data is not required. Auspex Observatory™ does not require administrative access to your systems and does not require access to your data. We use network flow data and log data to model and map your networks. If your data is inadvertently transmitted to us, it will be kept secure and private until it is removed. We do not share or sell Observatory user data.
CONTINUOUS INSIGHT
The Auspex Observatory™ platform is built to continuously update, ensuring that you never experience a lack of knowledge or real-time insights. Through our ongoing updates, you can stay informed with the latest information about your network. This proactive approach guarantees that you are equipped with up-to-date visibility, enabling you to make informed decisions and swiftly respond to any potential threats or access attempts. With Auspex Labs, you can trust that your knowledge of the network remains comprehensive and current at all times.


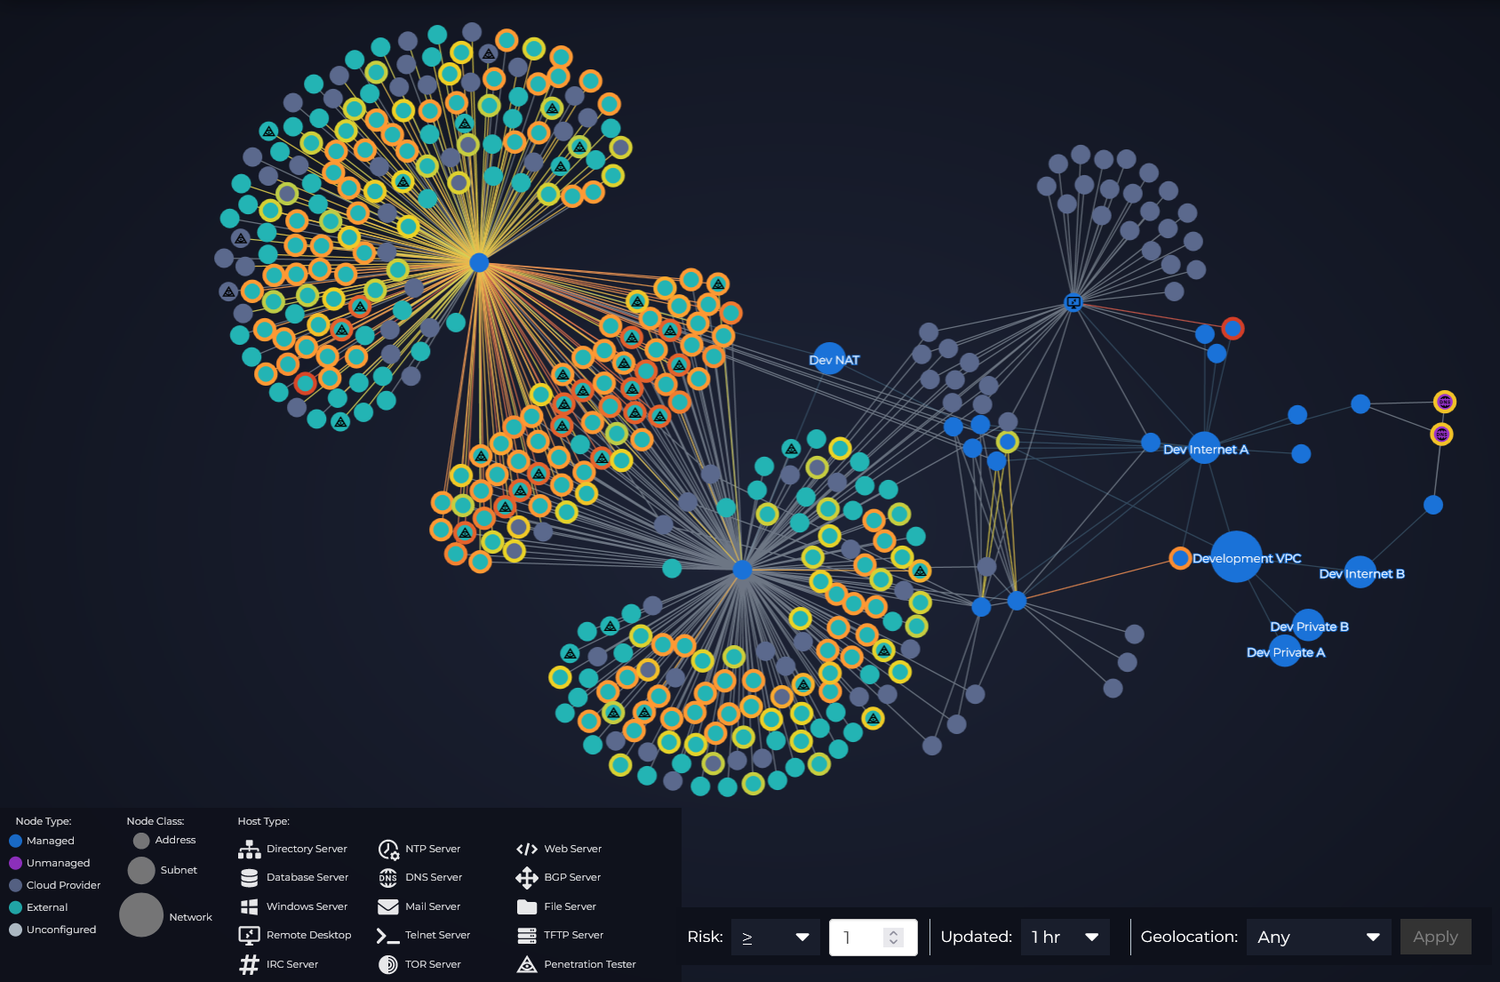
Visualize your network
Monitor device behavior, watch for threats, and detect misconfigurations using our intuitive interface
Real Time Automated Threat Hunting
So many pen-testers, so little time.
Using flow analytics, we are able to quickly identify penetration testers and other malicious actors. This information becomes part of our threat intelligence database, and is used to detect future attacks.
Unmanaged Host Detection
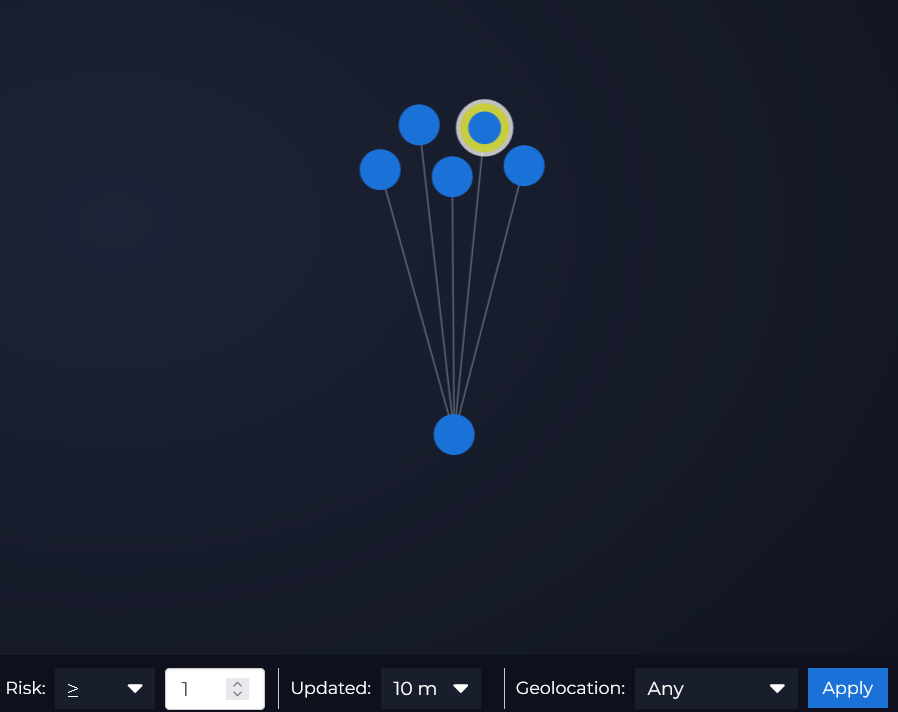
We look for display hosts that are not participating in active telemetry. Those unmanaged hosts could be rogue, failing, or require other attention.
A Trojan Story
Auspex Observatory's basic threat detection flagged an anomaly, flow analysis identified which ports were under assault, and all it took was a simple search to find that this particular threat was a trojan.
Frequently asked questions
-
Auspex Observatory is a data analytics platform that will provide insights on your network that can be used to identify cybersecurity risks, network misconfigurations, and other network and application issues.
-
Auspex Observatory collects and collates network metrics to provide a real-time map of your network and how the applications on your network are interacting. The data is summarized and stored using proprietary data structures using databases which have been optimized for this task.
-
The user interface for Auspex Observatory is a standard web application which is accessed across the Internet. We use a commercial identity management provider to provide a secure login. All of the communications between the client and the Auspex Observatory back-end is encrypted using TLS.
The primary interface is called the System Map, this interface provides a graph view of your network and allows view elements in detail and easy navigation of your networks. In addition to the System Map there is a threats page which provides a tabular view of the top ten internal and external IP addresses sorted by risk values.
-
Auspex Observatory requires minimal training to use effectively. Most IT professionals, even with minimal experience can effectively use Auspex Observatory to identify potential threats and network misconfigurations. Basic introductory training is available upon request to support.
-
Customized and in-depth training on Auspex Observatory is available as a professional services engagement. Please contact sales for more details.
-
Phone and email support is available for the first 45 days of service without charge. Email support is always available without charge. All support is handled by U.S. based staff.
-
Customers of Amazon Web Services can connect their environments to Auspex Observatory using the AWS Marketplace. Simply subscribe and deploy the Cloud Formation template we provide. The Cloud Front template is configured to collect the VPC flow logs from a single VPC. If you have multiple VPCs or wish to only monitor specific subnets, please contact support for a customized CloudFront template.
-
Yes! Please contact sales for a service agreement. Flow data will be transmitted to Auspex Observatory using Elastic’s Packetbeat or File Beat Agents. The Engineering team will work with you to develop the Beats configuration that is best for your use case and ensure that your account is properly configured.
-
One of the key advantages of Auspex Observatory is that we only collect network meta-data and do not collect any of your proprietary data. All of the data that we received is tagged and isolated from other customer data. All requests for data through the Auspex Observatory user interface and API are validated twice, once for the request and once for the database access to ensure that each user only has access to their own data. All data traversing the Internet is encrypted using TLS 1.2 or greater. All data in the system is encrypted in transit and at rest.
-
Auspex Observatory is a cloud native application that has been designed with a target availability of 99.999%.
-
The Auspex Labs team uses a continuous integration and continuous deployment strategy combined with aggressive automated and human quality assurance to minimize defects being deployed to production. Updates to the system that require client updates are accompanied by a notification at least 24 hours in advance. Client updates simply require a refresh of the client. API changes will be accompanied by at least one week’s notice for breaking changes.
-
Auspex Observatory has been designed to be extremely scalable. Auspex Observatory is built using a loosely coupled micro-services strategy that allows us to scale up and down as needed. The environment is automatically evaluated every 5 minutes and adjusted as needed. The last load test took us to 7 million transactions per second, a typical network will provide less than 1,200 transactions per second. Since our last load test there have been a number of improvements on the processing and database code which have significantly improved our performance and capacity.
-
We can support multiple offices in the United States. Due to regulatory conditions in Europe, special accommodations may be needed to support overseas offices. At this time we do not support overlapping IP address ranges, if that is part of your requirements, please contact sales so that we may determine how best to support your use case.
-
TCP/IP. Auspex Observatory processes network flow logs presenting IP network metrics.
-
Auspex Observatory does not support low level protocols like Ethernet or non-IP based networks like IPX/SPX. If you have a need for a specific protocol, please ask.
-
The standard delivery of Auspex Observatory is through a web based interface. The interface supports the generation of PDF reports for summary information.
-
There is an API for Auspex Observatory, documentation is provided using the OpenAPI specification. Support for API integration is available as a professional services engagemen
-
The data which is transmitted to Auspex Observatory™ is only used within the application. Your data is used to model risks that are used to provide risk indicators for you and other customers. None of your data is provided to any other customer or any third parties. Public IP addresses that have generated risk in your account will be represented as having risk in other accounts, but none of your utilization data or any other identifying data will be relayed, only the risk values.


